Understanding Loss Budgets: How to Calculate Them and Why They Protect Your Network

Every fiber optic network has a physics problem to solve: light has to travel from a transmitter on one end to a receiver on the other, and along the way it loses power at every splice, every connector, and every kilometer of glass. If the cumulative loss exceeds what the receiver can tolerate, the link fails. Loss budgets are the engineering tool that keeps every fiber link inside the window where it works reliably for decades.
For network owners, ISPs, and municipal broadband managers, a loss budget is more than a calculation buried in an engineer's notebook. It is the document that determines whether a network will function at handover, whether the installation contractor met specification, and whether the network will still work after the next splice or service drop is added. This guide covers what a loss budget is, how to calculate one, what the industry-standard numbers look like, and why this calculation protects your network investment long after construction ends.
What a Loss Budget Is and Why It Exists
A loss budget is an engineering estimate of how much optical power a fiber link should lose from transmitter to receiver, expressed in decibels. The calculation adds up three categories: the attenuation of the fiber itself over its length, the loss contributed by each fusion or mechanical splice, and the loss contributed by each connector pair. The sum is the expected total insertion loss, and that number becomes the benchmark the installed network has to meet or beat during testing.
The calculation serves two jobs. Before construction, it tells the designer whether the link as drawn is possible with the chosen transceivers and fiber type. If the loss budget already exceeds the power budget of the optics, the design has to change before anyone pulls cable. After construction, the same calculation becomes the pass-fail criterion for acceptance testing, where a technician tests insertion loss and compares the measured value against the calculated budget.
The Three Components of Every Loss Budget
Fiber attenuation is the loss contributed by the fiber itself, measured in decibels per kilometer. Single-mode fiber loses roughly 0.4 dB per kilometer at 1310 nm and 0.25 dB per kilometer at 1550 nm, the two most common outside plant wavelengths. The TIA-568 standard allows a maximum of 0.5 dB per kilometer at either wavelength for outside plant single-mode cable. Multimode fiber loses more, typically around 3 dB per kilometer at 850 nm and 1 dB per kilometer at 1300 nm.
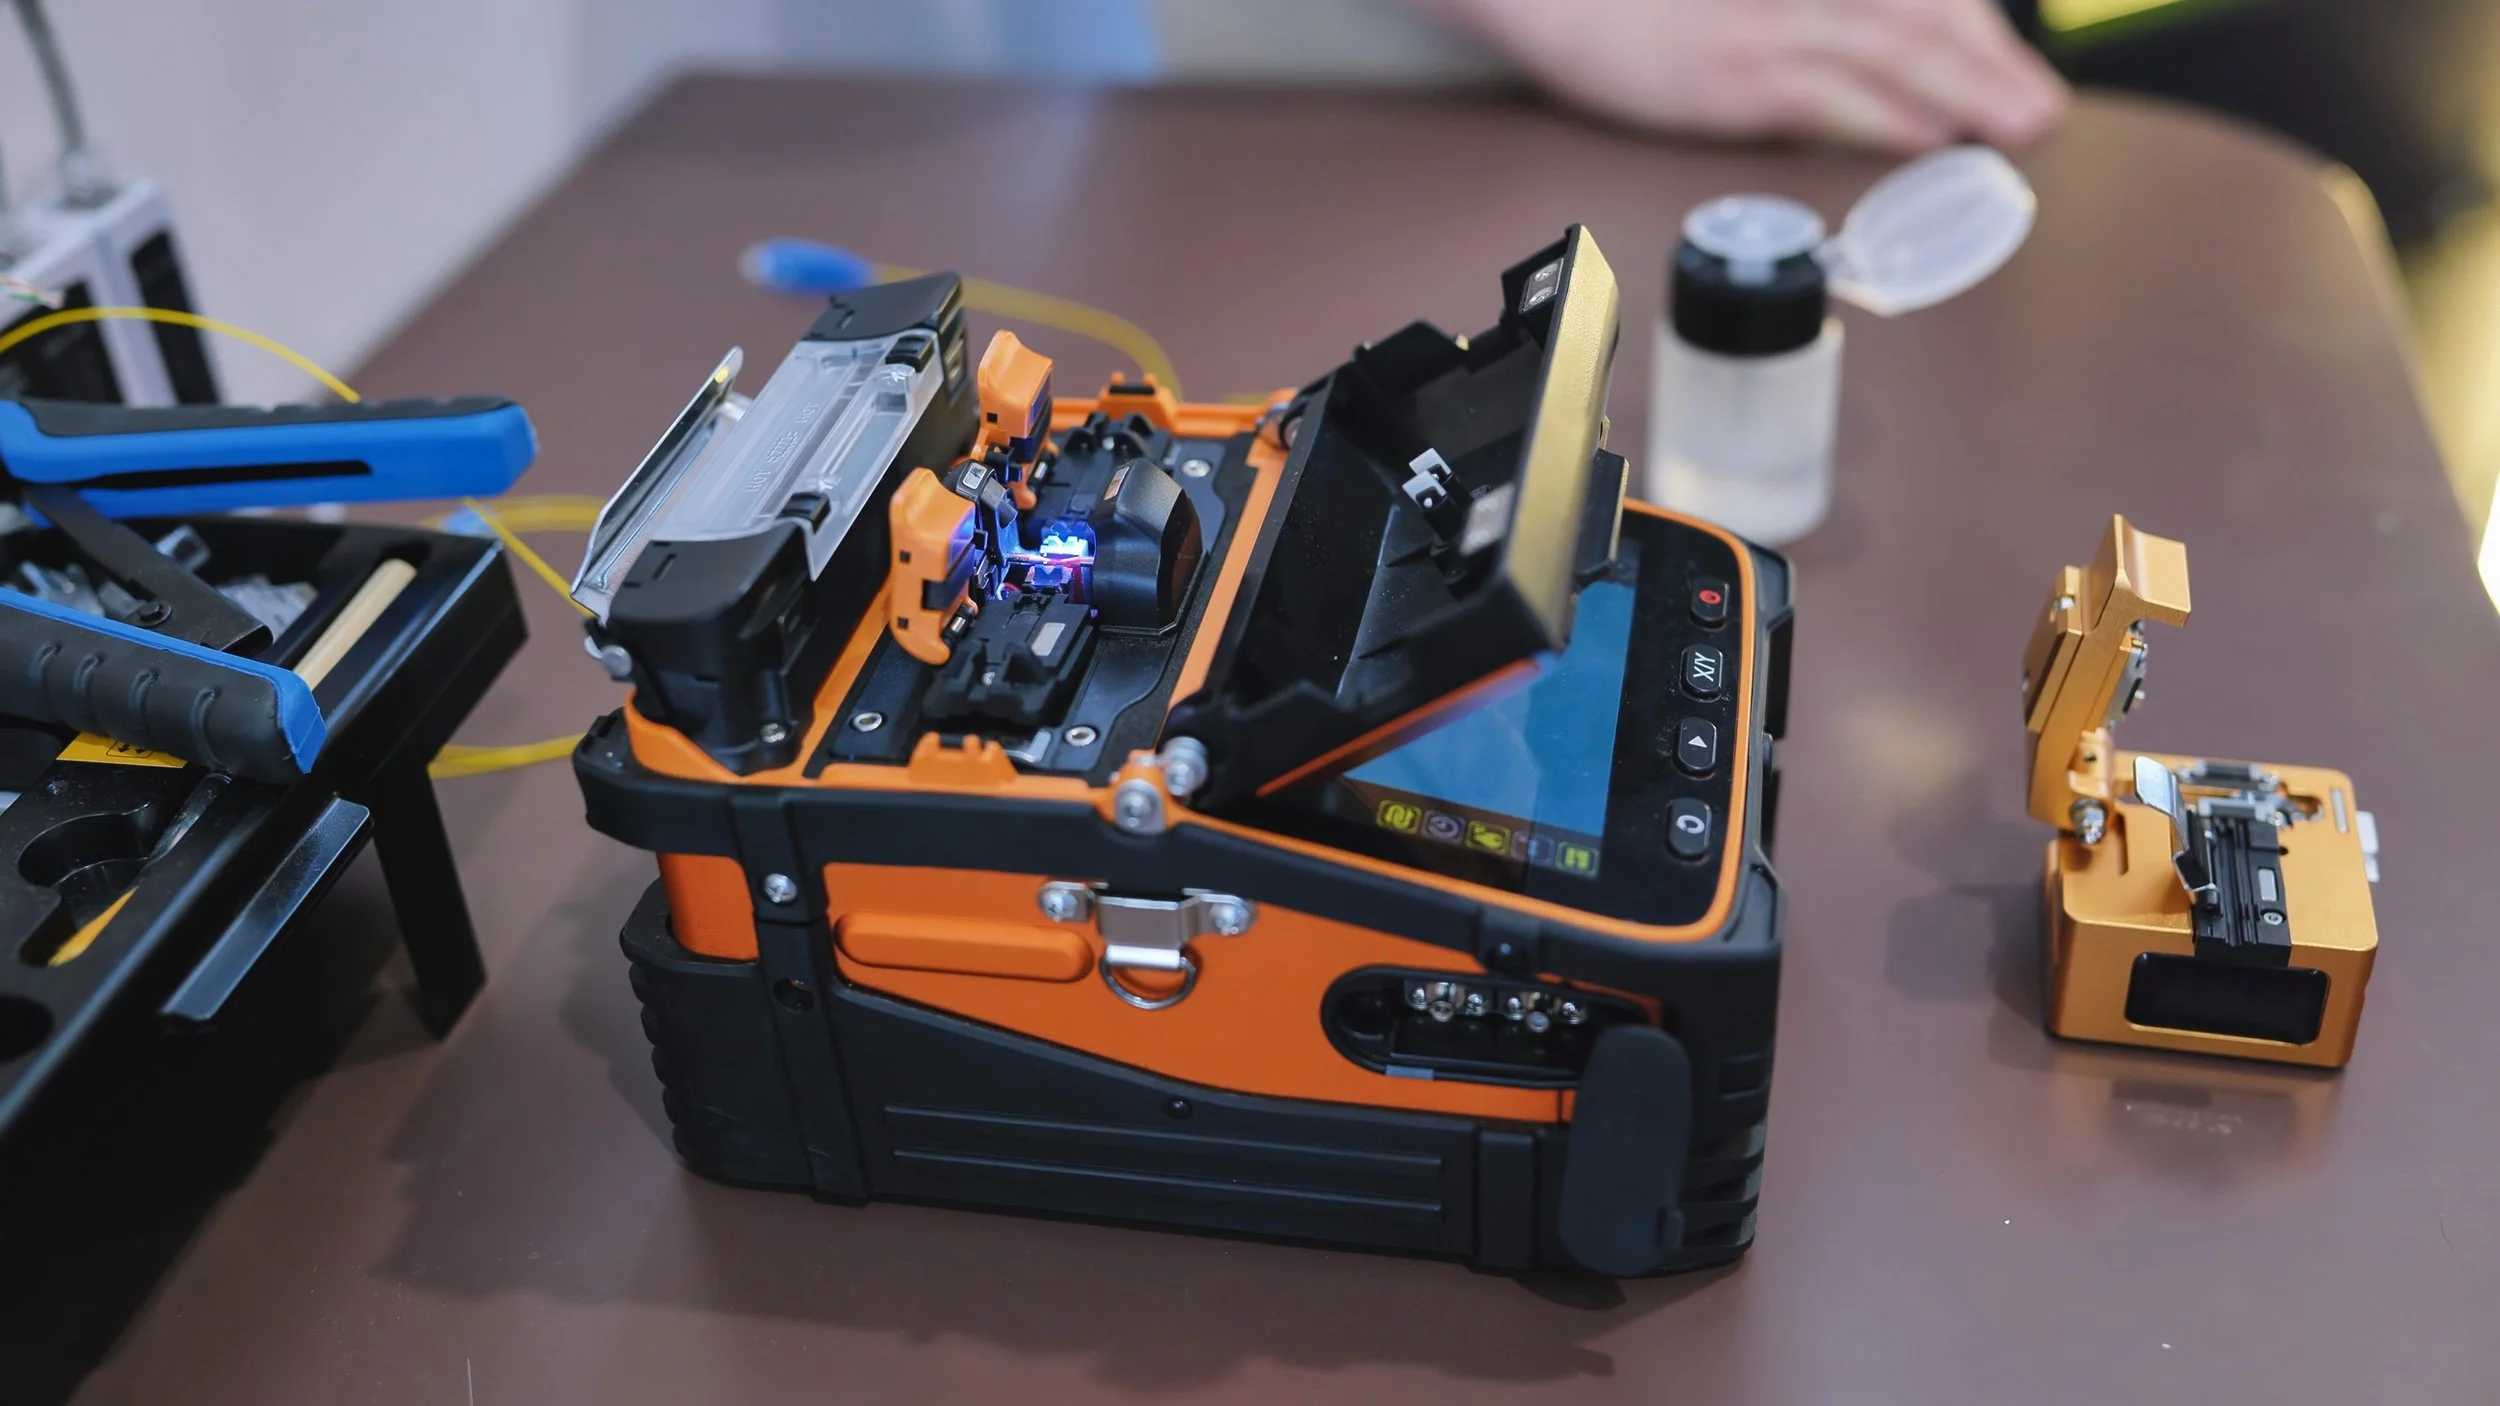
Splice loss is the loss at each point where two fibers are joined. Modern fusion splicing of single-mode fiber produces typical losses of 0.05 to 0.1 dB per splice when performed by a qualified technician on properly prepared fiber. Mechanical splices run higher, typically 0.3 dB or more. The TIA-568 standard caps splice loss at 0.3 dB maximum for acceptance, which is what most loss budget calculations use as the worst-case value.
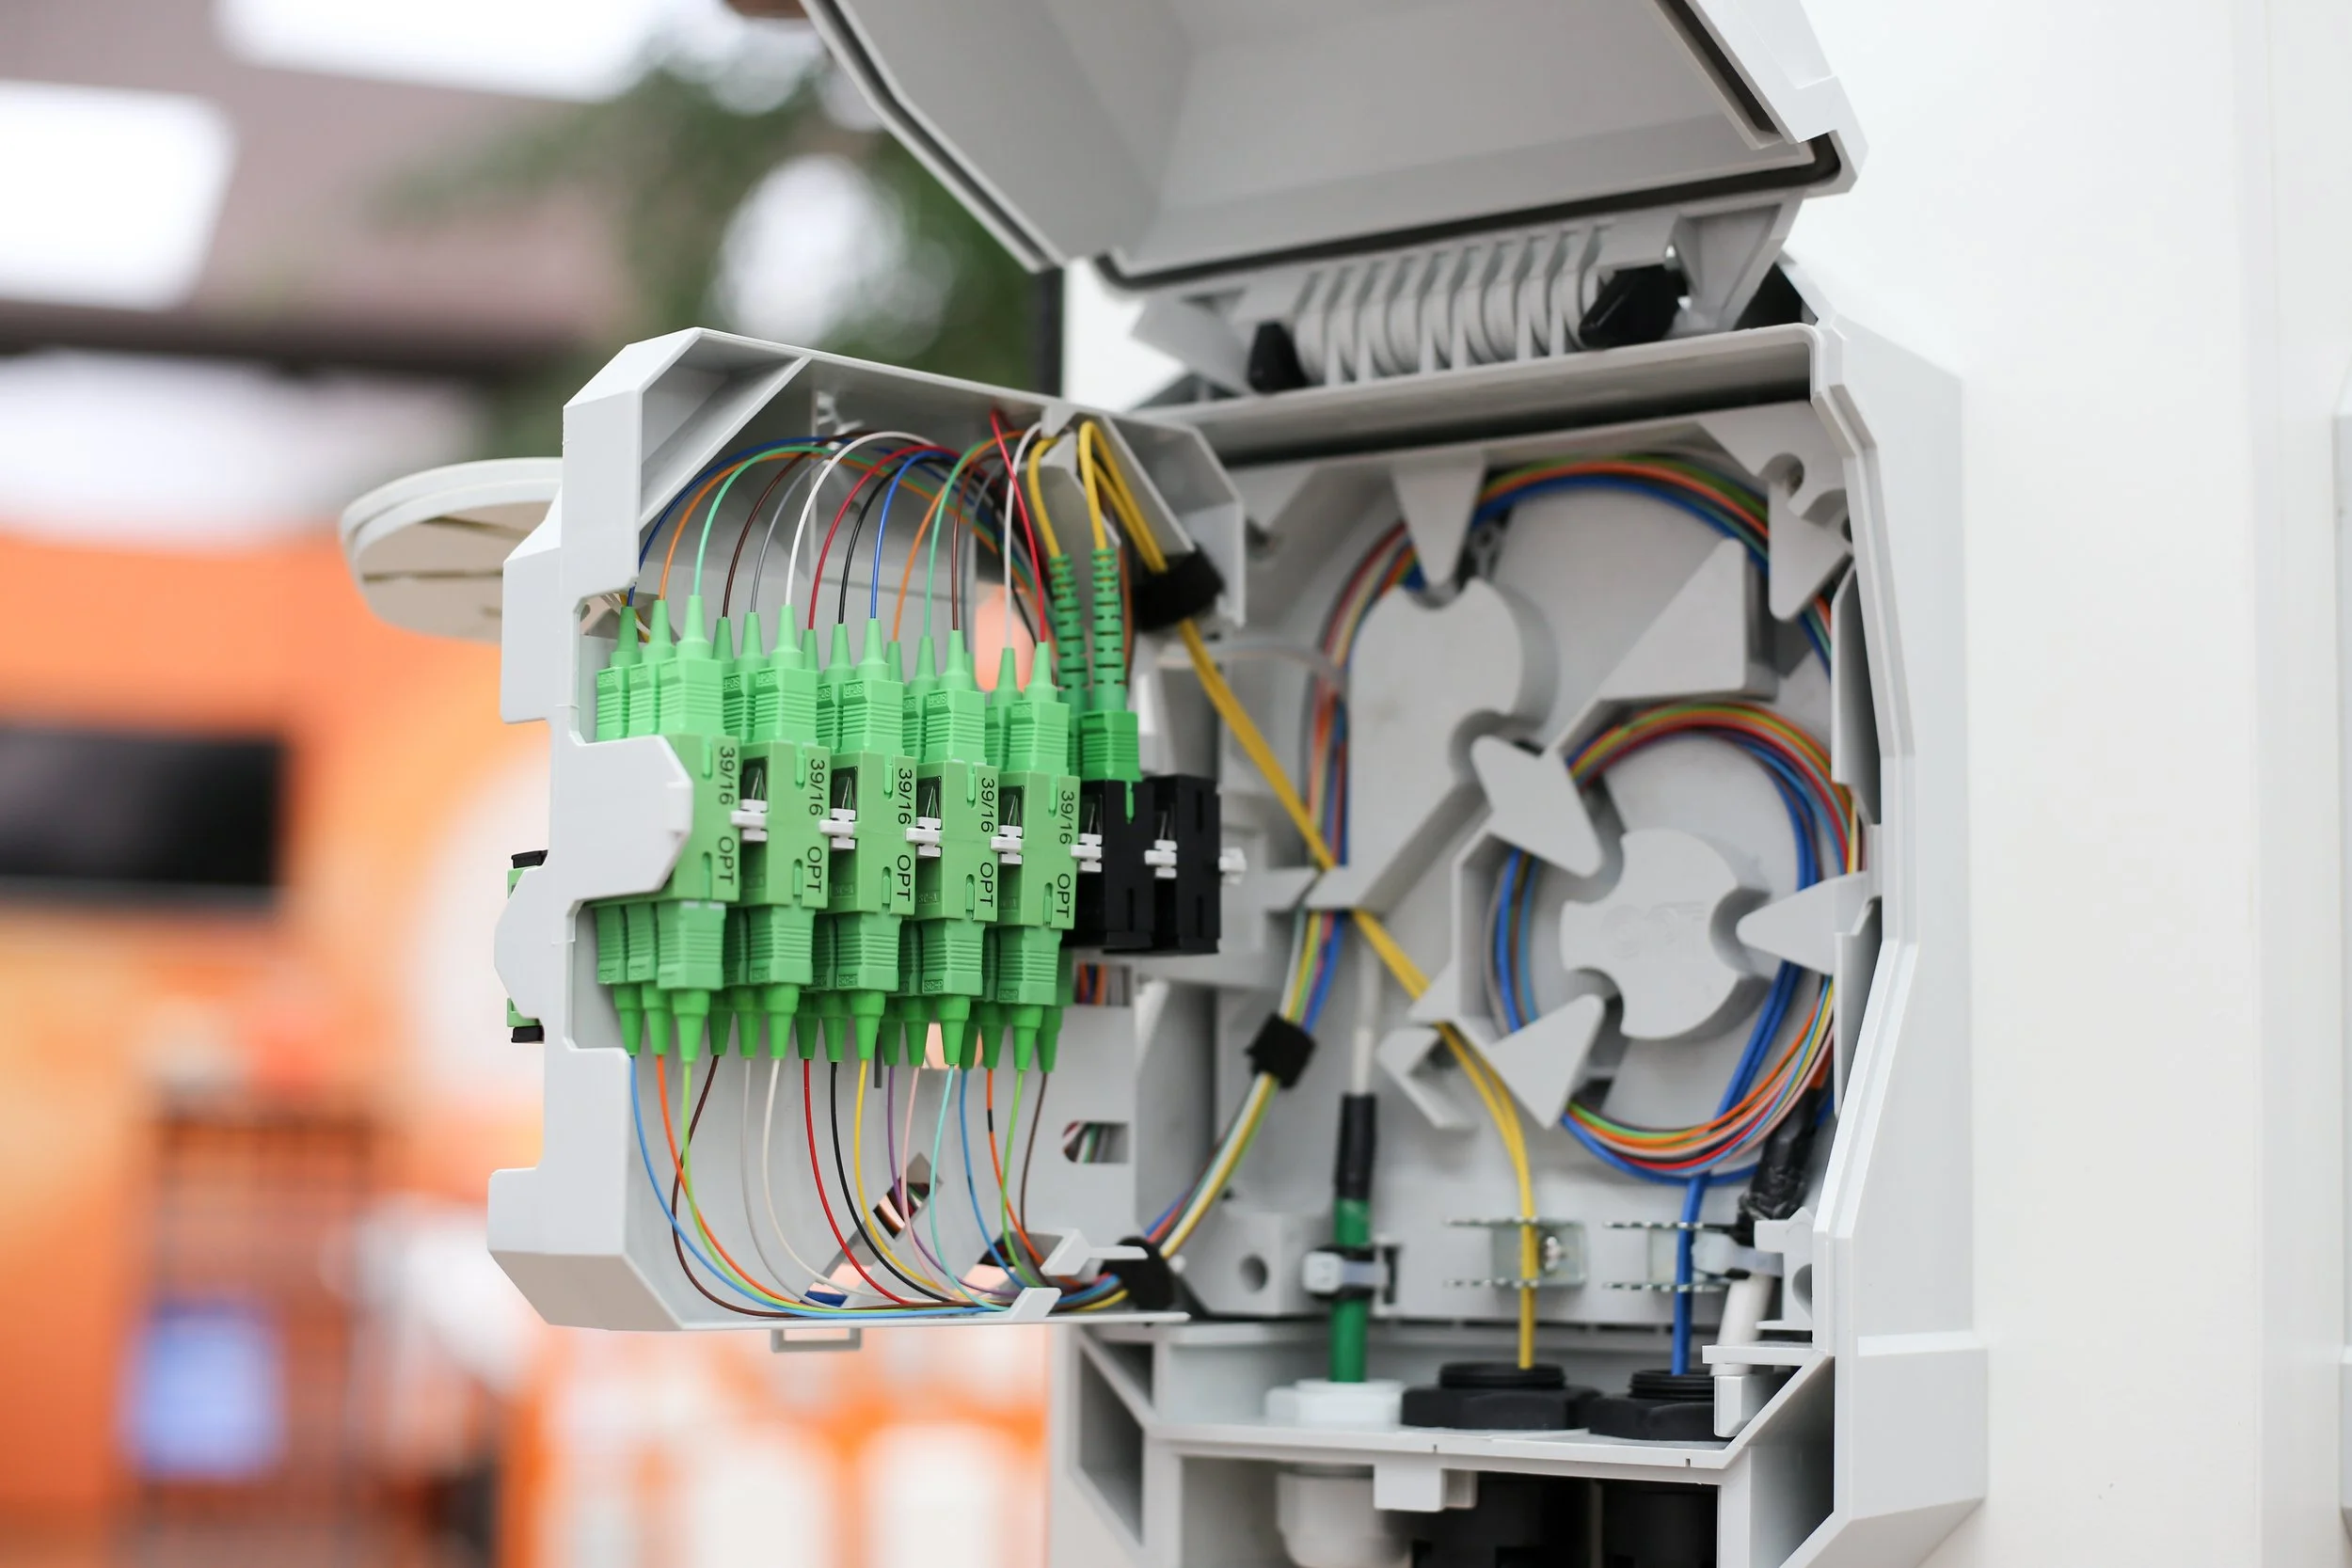
Connector loss is the loss contributed at each mated pair, typically found at patch panels, equipment enclosures, and drop terminals. The TIA-568 standard allows up to 0.75 dB per mated pair for standard-grade connectors, though modern field-terminated connectors typically perform at 0.3 dB or better under clean conditions. Every patch cord introduces two mated pairs, so the count adds up on a link with multiple patching points.
How to Calculate a Simple Loss Budget
The formula is straightforward addition. Total link loss equals cable attenuation plus splice loss plus connector loss, where each is the number of that item multiplied by the per-item loss value. Consider a single-mode outside plant link running 10 kilometers at 1310 nm, with five fusion splices and one mated connector pair at each end, for a total of two mated pairs.
Fiber attenuation contributes 10 km multiplied by 0.4 dB per km, which equals 4.0 dB. Splice loss contributes 5 splices multiplied by 0.1 dB per splice, which equals 0.5 dB. Connector loss contributes 2 mated pairs multiplied by 0.75 dB per pair, which equals 1.5 dB. Total expected link loss is 6.0 dB. If the installed link tests at 6.5 dB or lower during acceptance, it meets specification. If it tests at 9 dB, something is wrong and the link needs to be troubleshot before acceptance.
Industry organizations publish loss budget calculators that automate this math, and the Fiber Optic Association's loss budget reference is one of the most widely used working guides for designers and technicians. The arithmetic is simple, but the discipline of doing it for every link before construction and comparing against test results after is what separates professional installations from ones that pass inspection only to fail in service.
Power Budget vs. Loss Budget: Knowing the Difference
Loss budget and power budget are related calculations that get confused constantly, but they measure different things. The loss budget describes what the cable plant loses between transmitter and receiver. The power budget describes how much loss the optical equipment can tolerate before the link fails, measured as the difference between transmitter output power and receiver minimum sensitivity.
A link functions when the loss budget is less than the power budget, with enough margin to absorb degradation from aging connectors, future splices, and normal component drift. A typical design reserves 3 dB of margin above the calculated loss budget, giving the network room to accommodate the inevitable changes over a 25 to 30 year service life. A network installed at the edge of its power budget may work perfectly on day one and fail three years later when a crew adds a single service drop.
Where Loss Budgets Prevent Expensive Problems
The first place a loss budget earns its keep is during design review. A project manager who accepts a contractor's proposal without seeing the loss budget calculation is signing up for a link that may or may not meet specification, with no objective way to evaluate installation quality. The loss budget tells the owner in advance what the link should test at, turning test results into an objective pass-fail check.
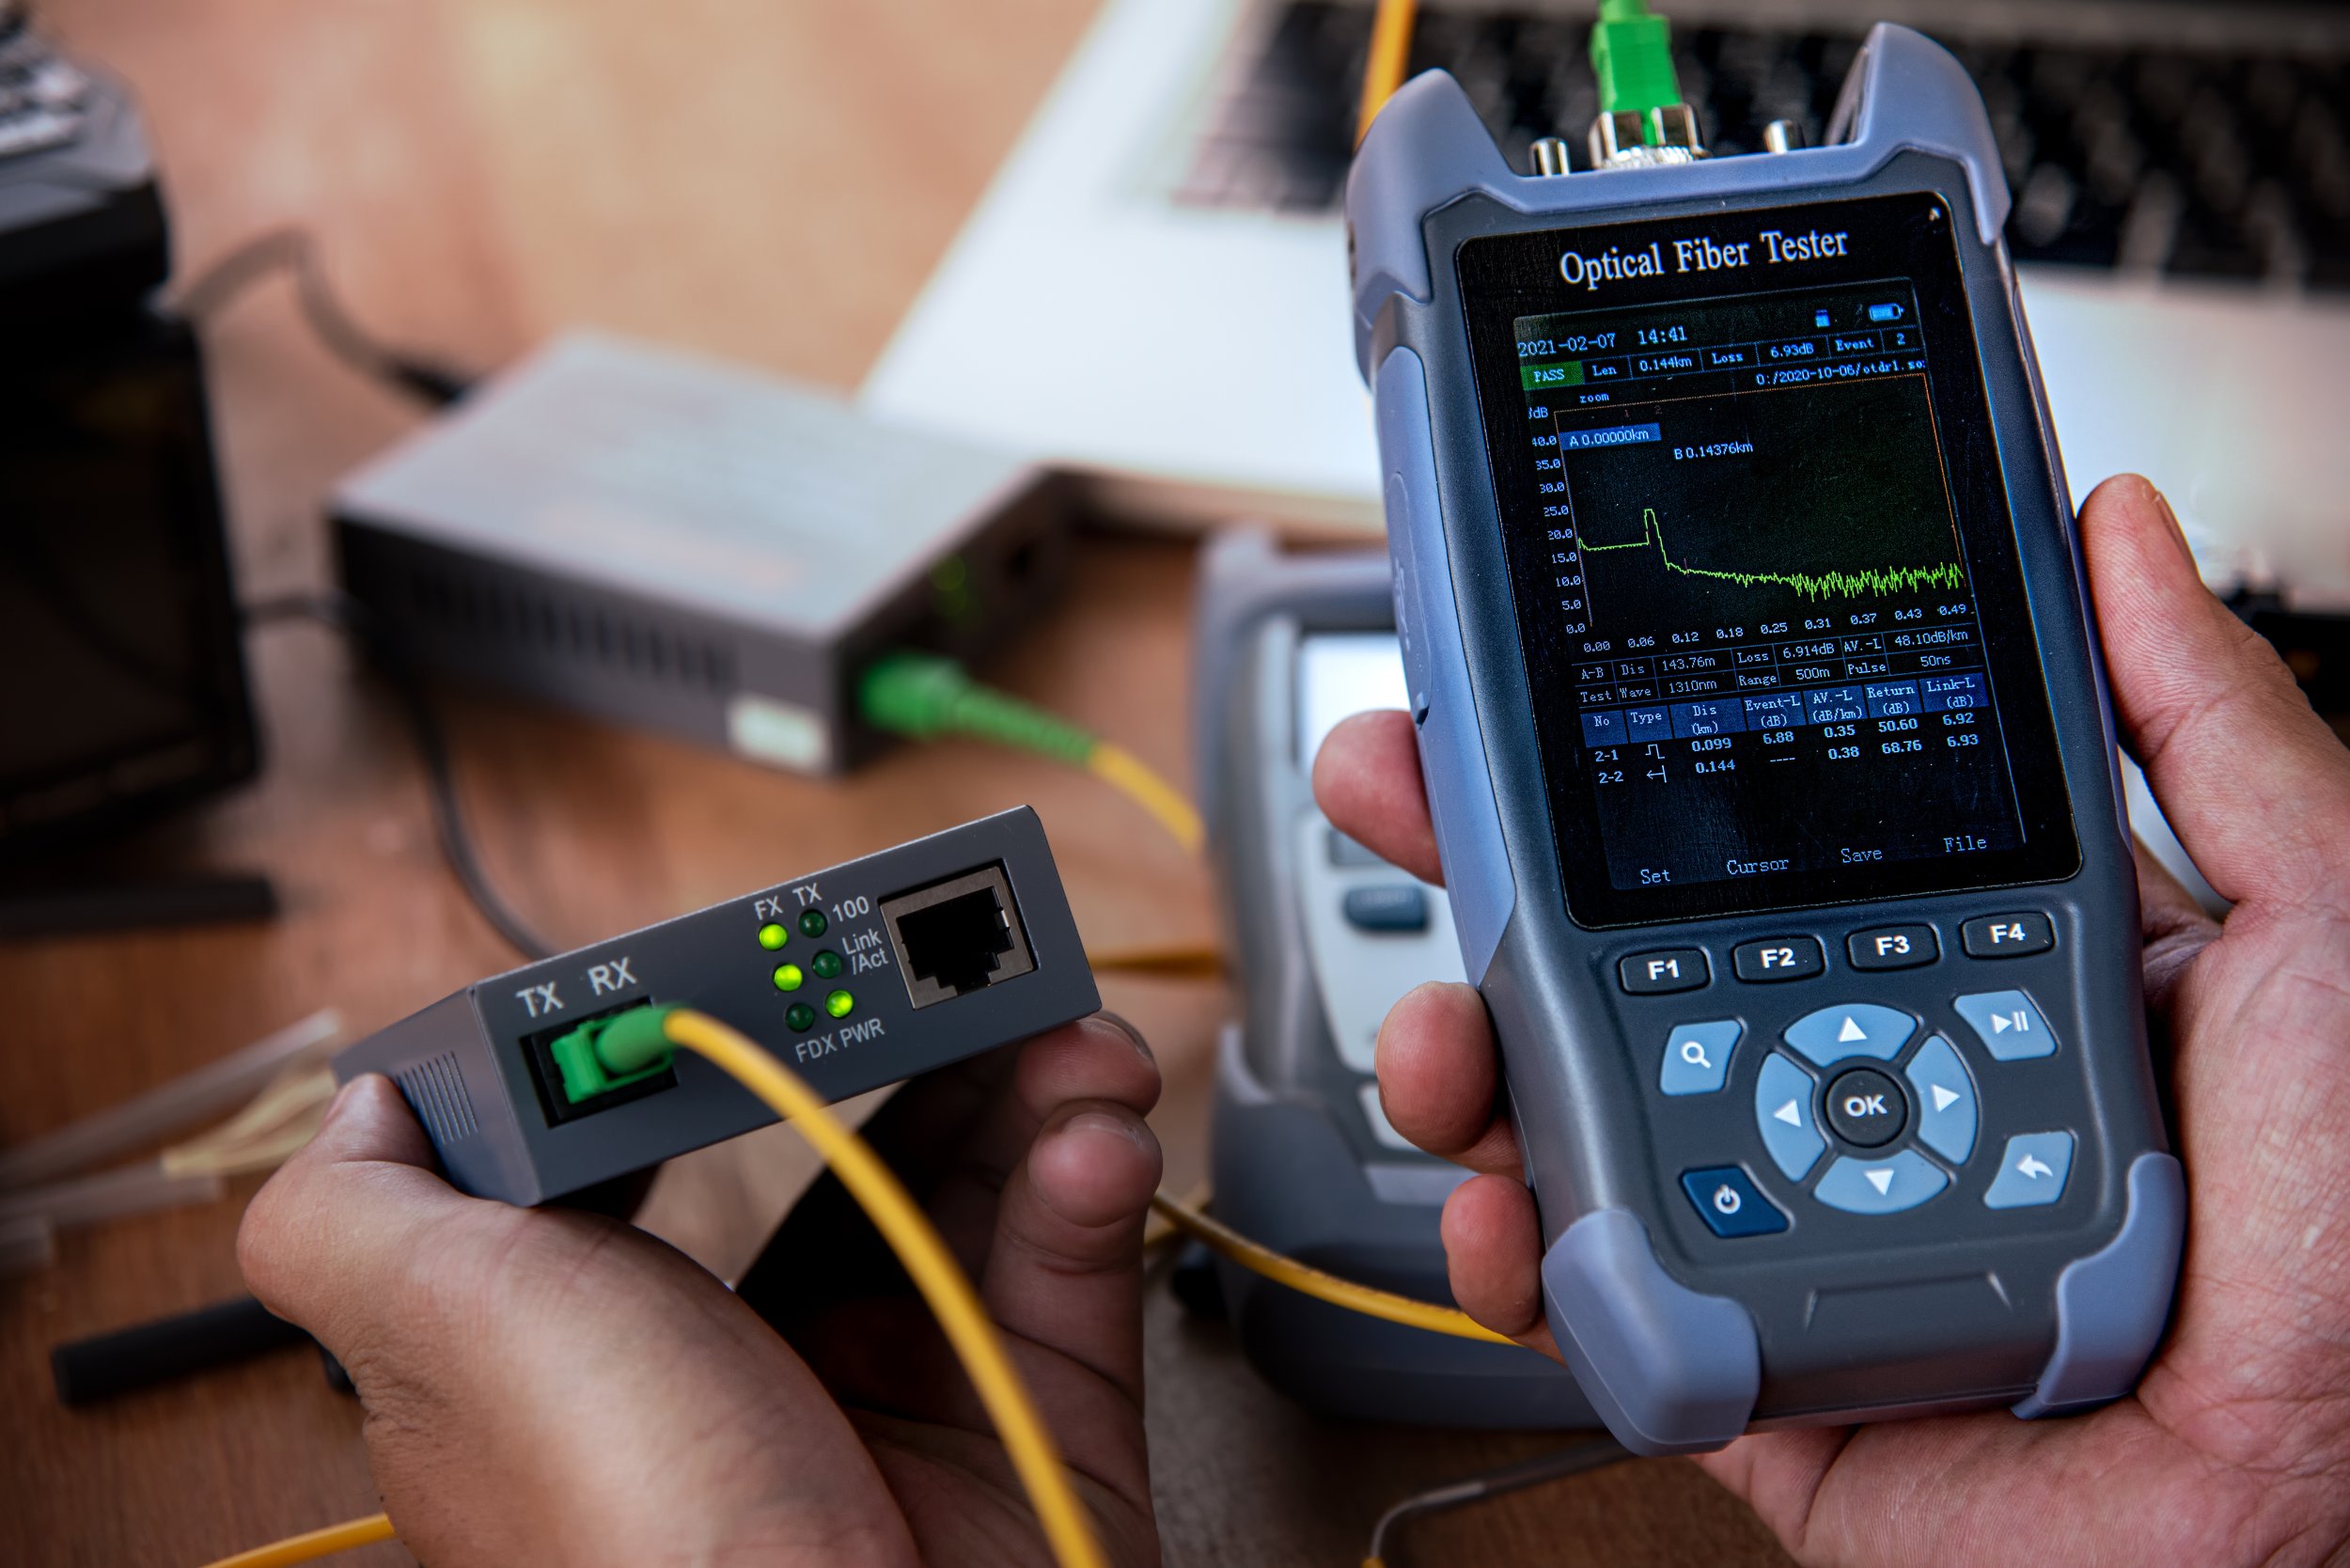
The second place is during troubleshooting. When a link fails in service or tests above its expected value, the budget tells the technician where the problem is likely hiding. A link that tests 2 dB above budget probably has a problem at one or two specific locations rather than being generally degraded. OTDR testing then localizes the fault to a specific splice, connector, or span. For reference on acceptance testing, IEEE 802.3 Ethernet standards establish the receiver sensitivity values that Ethernet-based networks have to work within.
The third place is during future expansion. Every time a service drop is added, a splice is repaired, or a new span is joined to the network, cumulative loss increases. Projects that documented loss budgets and test results during initial construction have a baseline to compare against when deciding whether the network can absorb the added loss. Projects that skipped the documentation are guessing.
The Mistakes That Undermine Loss Budgets
The most common mistake is using optimistic values for splices and connectors in the budget. A designer who assumes 0.05 dB fusion splices and 0.3 dB connectors produces a tight budget that looks good on paper but leaves no margin for real-world conditions. Using the TIA-568 maximum values of 0.3 dB per splice and 0.75 dB per connector gives a conservative budget that accommodates normal variation in splice quality and connector cleanliness.
The second mistake is ignoring measurement uncertainty. Every optical loss test has some inherent uncertainty, typically 0.2 to 0.5 dB depending on the equipment and method. A link that tests right at the calculated budget may actually be slightly above or below that value once uncertainty is accounted for. Acceptance criteria should include a tolerance band that reflects real-world measurement limits.
The third mistake is skipping the as-built loss budget. A loss budget calculated from design drawings is a starting point, but the as-built network always differs from the design in small ways: an extra splice added around an obstruction, a slightly different route, a replaced connector. The final loss budget should reflect what was actually installed, because that is the number future maintenance crews will work from.
What Network Owners Should Require From Their Contractor
A professional fiber installation should deliver three loss budget documents at project completion. The first is the designed loss budget calculated before construction, showing expected link loss based on planned route, splice count, and connector count. The second is the as-built loss budget updated to reflect the installed plant. The third is the set of measured test results, showing insertion loss and OTDR traces for every fiber compared against the as-built budget.
Network owners who require this documentation at acceptance get three things: objective proof the installation met specification, a working baseline for future maintenance, and a reference point for troubleshooting when something goes wrong. Network owners who skip the documentation save a small amount of time at close-out and spend much more time years later trying to figure out why a link no longer performs.

Building Networks That Hold Their Loss Budget for Decades
Loss budgets protect fiber networks because they turn an invisible physical process into a measurable, documented number. A well-calculated, conservatively budgeted, thoroughly tested network gives its owner a durable asset with predictable performance. A network built without that discipline depends on luck.
TermLink Solutions calculates loss budgets as part of every project we take on, tests every fiber against those budgets at acceptance, and delivers complete documentation at close-out. Our crews understand the difference between a link that technically works and a link engineered to keep working as the network grows and ages. If you are planning a new fiber build, evaluating contractor test documentation, or troubleshooting performance issues, reach out to our team and let's make sure your network is operating inside its designed performance envelope.