

Technology Neutrality Changed the Mix. Here Is Where Fiber Still Wins on Cost
For three years, federal broadband policy put a thumb on the scale for fiber. Then it stopped.
The industry reaction split into two camps almost immediately. One treated the change as the end of the fiber era. The other insisted nothing meaningful had happened. Now that every state plan is approved and the numbers are public, we can skip the speculation and look at what a cost-first test actually selected.
Fiber won 63 percent of the locations. Not because a rule required it, but because it priced better than the alternatives across most of the country.
That result deserves more attention than it has gotten, because it says something specific about where fiber economics work and where they do not. Anyone planning a build should understand the difference.
What technology neutrality actually did
In June 2025, NTIA issued a restructuring policy notice that reshaped how BEAD subgrantees are selected. The prior framework limited priority broadband projects to end-to-end fiber, which the notice found relegated other technologies to a lower tier and limited competition. The revised approach allows all qualifying technologies to compete for priority status and funding based primarily on cost.
States were required to rerun their selection processes under a new round scored on the revised criteria. Every approved plan in the country now reflects that scoring.
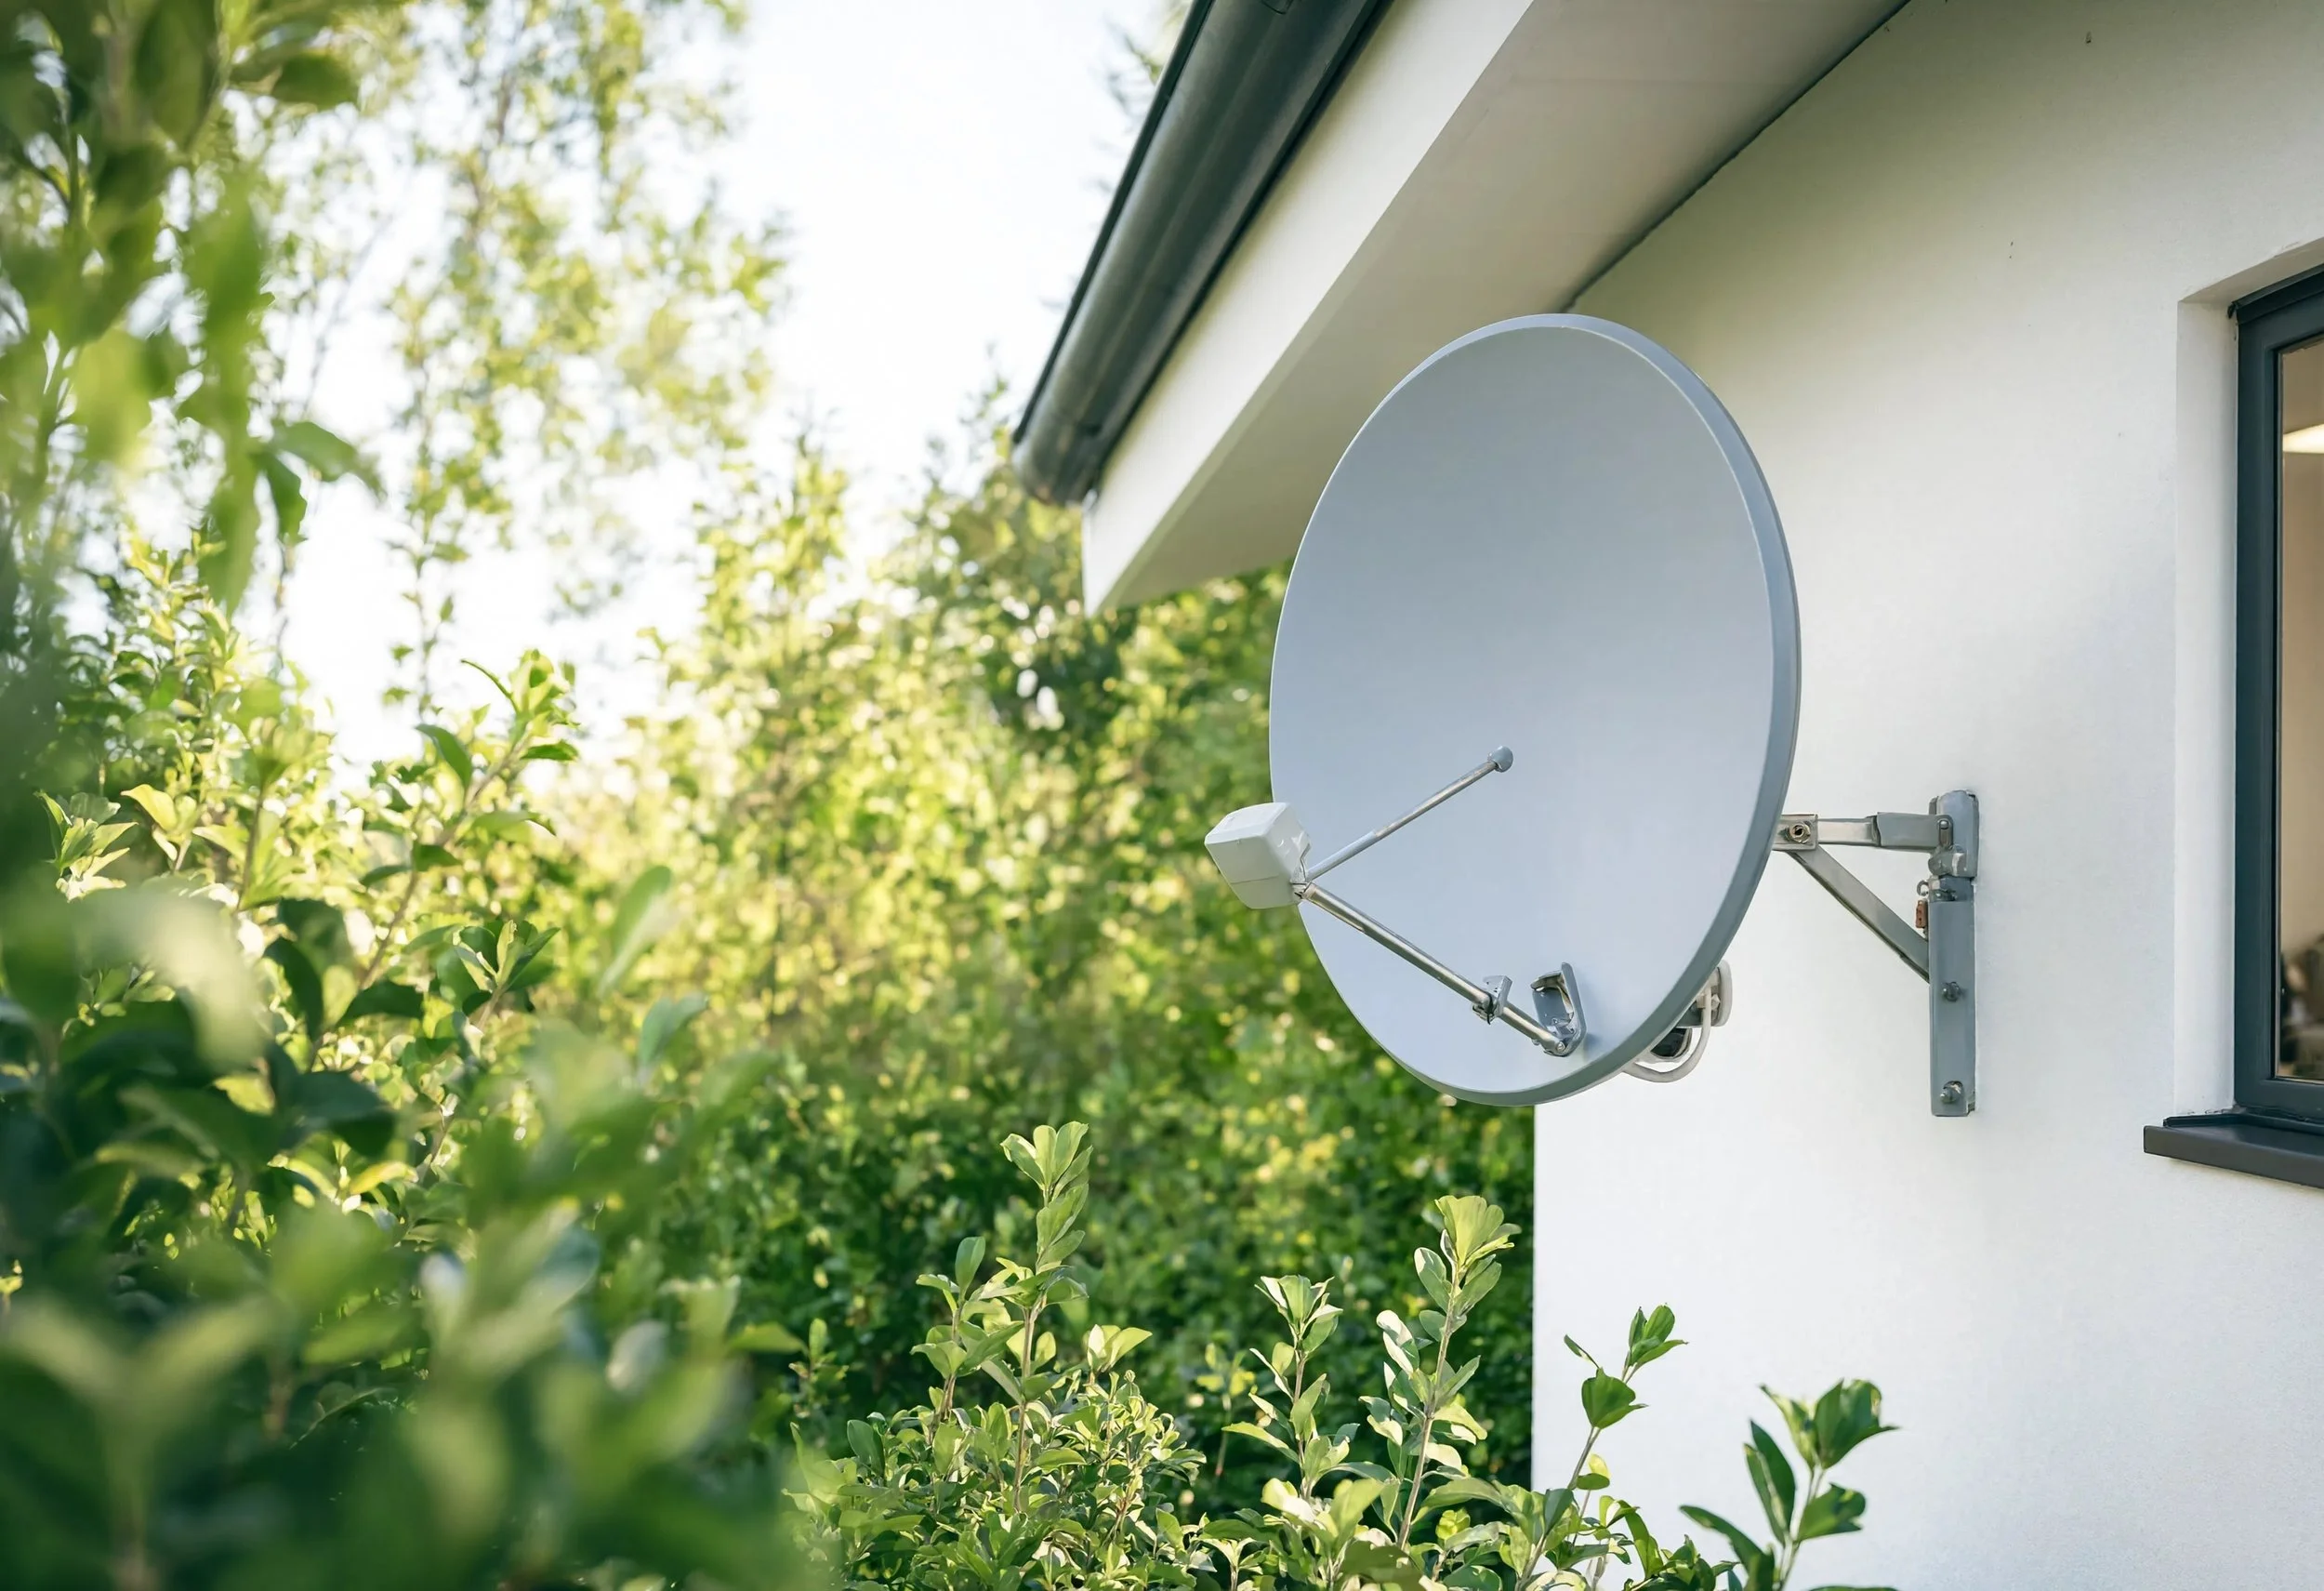
We covered how grant funding moves toward construction in an earlier post. This one is about what the funding actually bought.
Fiber won on price, which is a stronger endorsement than a preference
Across the approved plans, states are set to serve about 3.79 million locations. Roughly 62.9 percent of those are slated for fiber. Satellite takes about 21.9 percent. Fixed wireless takes about 13.3 percent, and the small remainder goes to cable.
The Fiber Broadband Association's 2025 Fiber Deployment Cost Annual Report records the same figure from the industry side, noting that fiber was selected for 63 percent of eligible locations under BEAD.
That number carries weight precisely because nothing required it. Under a preference regime, a high fiber share proves only that the rule worked as written. Under a cost-primary test, a high fiber share means fiber submitted the cheaper bid at most locations in the country. Those are very different claims, and the second one is the useful one.
Why fiber wins where it wins
The short answer is that fiber wins where the route already exists.
The same FBA and Cartesian research puts the median aerial fiber deployment cost at roughly $8.00 per foot against roughly $18.00 per foot for construction that has to go into the ground. Labor accounts for about 64 percent of aerial deployment cost, with median aerial labor near $4.50 per foot.
That gap is the whole story. An existing pole line is an existing right of way with an existing path already cleared and permitted in principle. There is no surface to restore and no ground to disturb, which strips out both the most expensive labor and the most variable cost driver on the job. Our post on strand and lashing in aerial builds covers the mechanics of why that work moves as quickly as it does.
Density does the rest. Cost per location falls sharply when locations cluster along a route that has to be built anyway. A road with 15 homes on it and a pole line already running past them is close to the ideal case for fiber under any scoring rubric. The marginal cost of the sixteenth home is small.
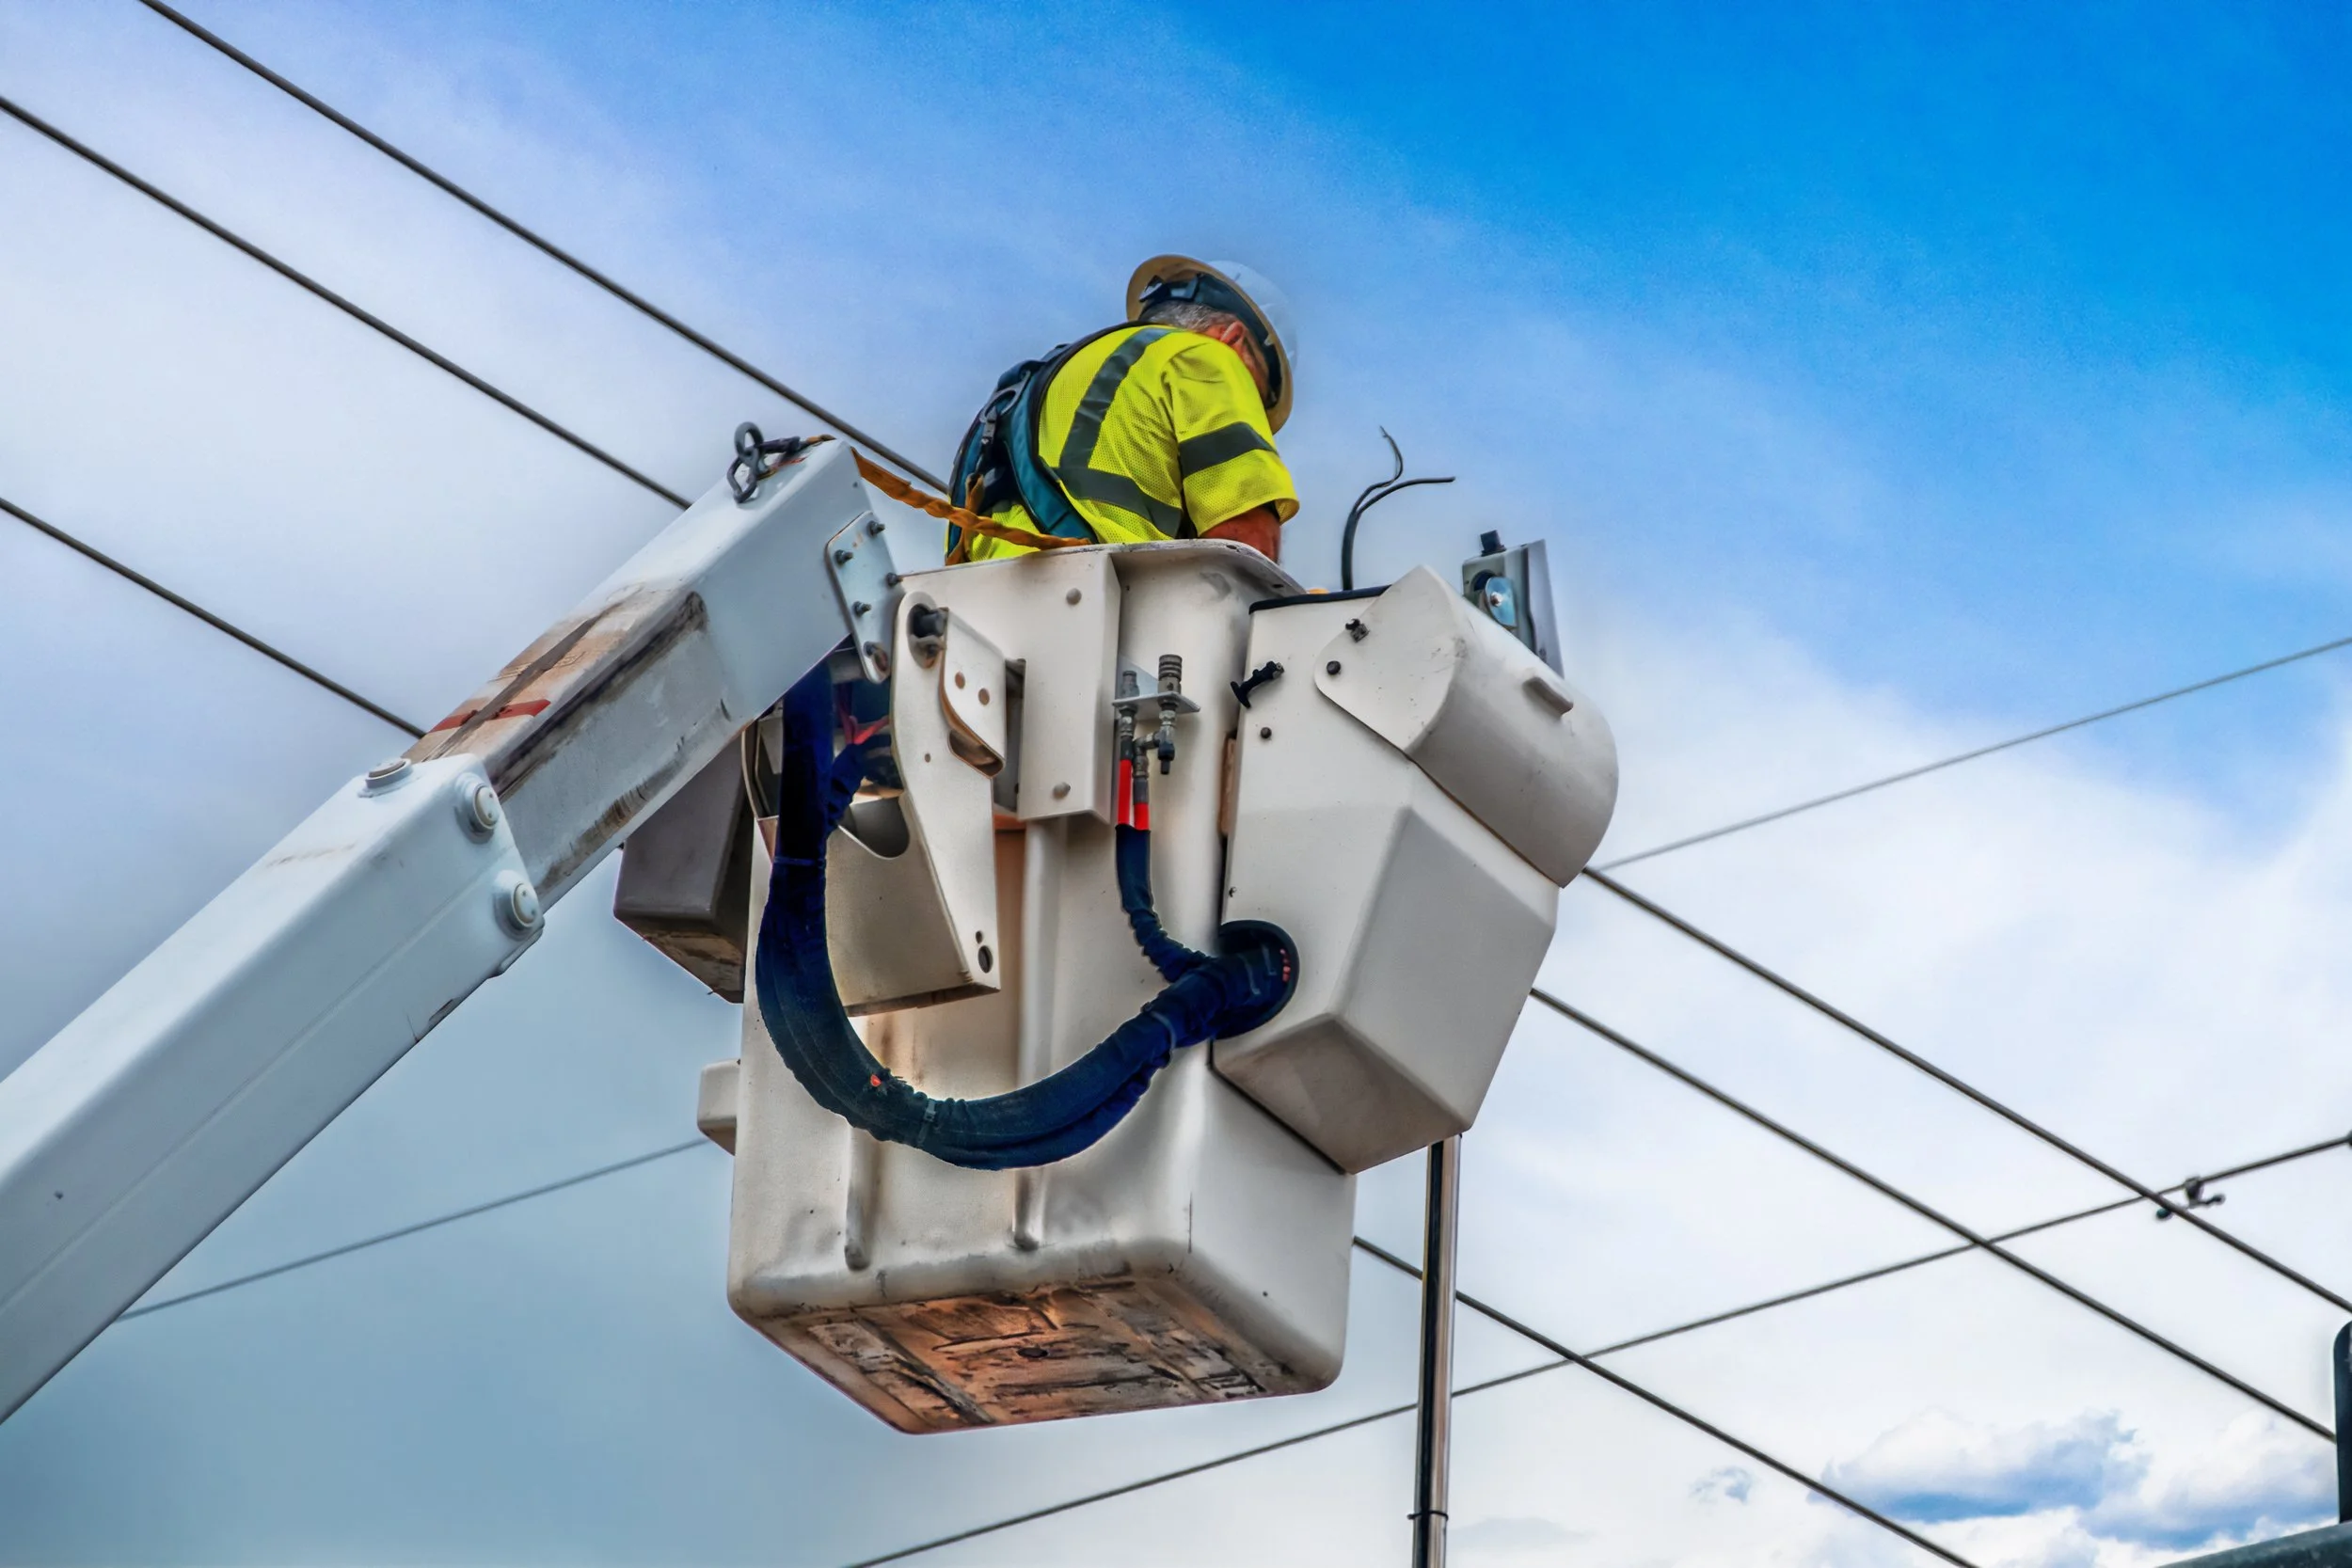
This is also why aerial capability determines whether fiber is even in the conversation on a given route. A provider without an aerial crew is bidding a materially different cost structure on the same locations.
Where it does not win, and why that is worth saying plainly
Fiber loses the cost argument on isolation.
A single home at the end of a two-mile spur with no other locations along the way has no density to share the cost with. The per-location number climbs into territory no scoring rubric will reward, and no amount of preference for fiber changes the arithmetic. That is the case satellite was funded to solve, and it is a reasonable use of it.
Pennsylvania's plan illustrates the split cleanly. Of the 129,356 locations covered by the Commonwealth's award, roughly 74,878 are slated for fiber and 29,884 for low Earth orbit satellite, with fixed wireless and hybrid fiber coax covering the rest. In a state with the terrain Pennsylvania has, that mix is what a cost test produces when it runs honestly.
Pretending otherwise does not help anyone. A contractor who tells a municipality that fiber is the right answer for every location in the township is going to be wrong somewhere, and the credibility lost there is not worth the locations gained.
The costs that do not appear in a bid
A selection process scored on deployment cost measures what it can measure, which is the price of building the thing. There are real costs it does not capture.
Capacity is the clearest one. A fiber plant built today has headroom that outlives the electronics on either end of it, and adding capacity generally means changing equipment rather than rebuilding the route. Longevity is the other. Glass in the air is a multi-decade asset, and the replacement cycle on the plant itself is measured in a timeframe most municipal capital plans never reach.
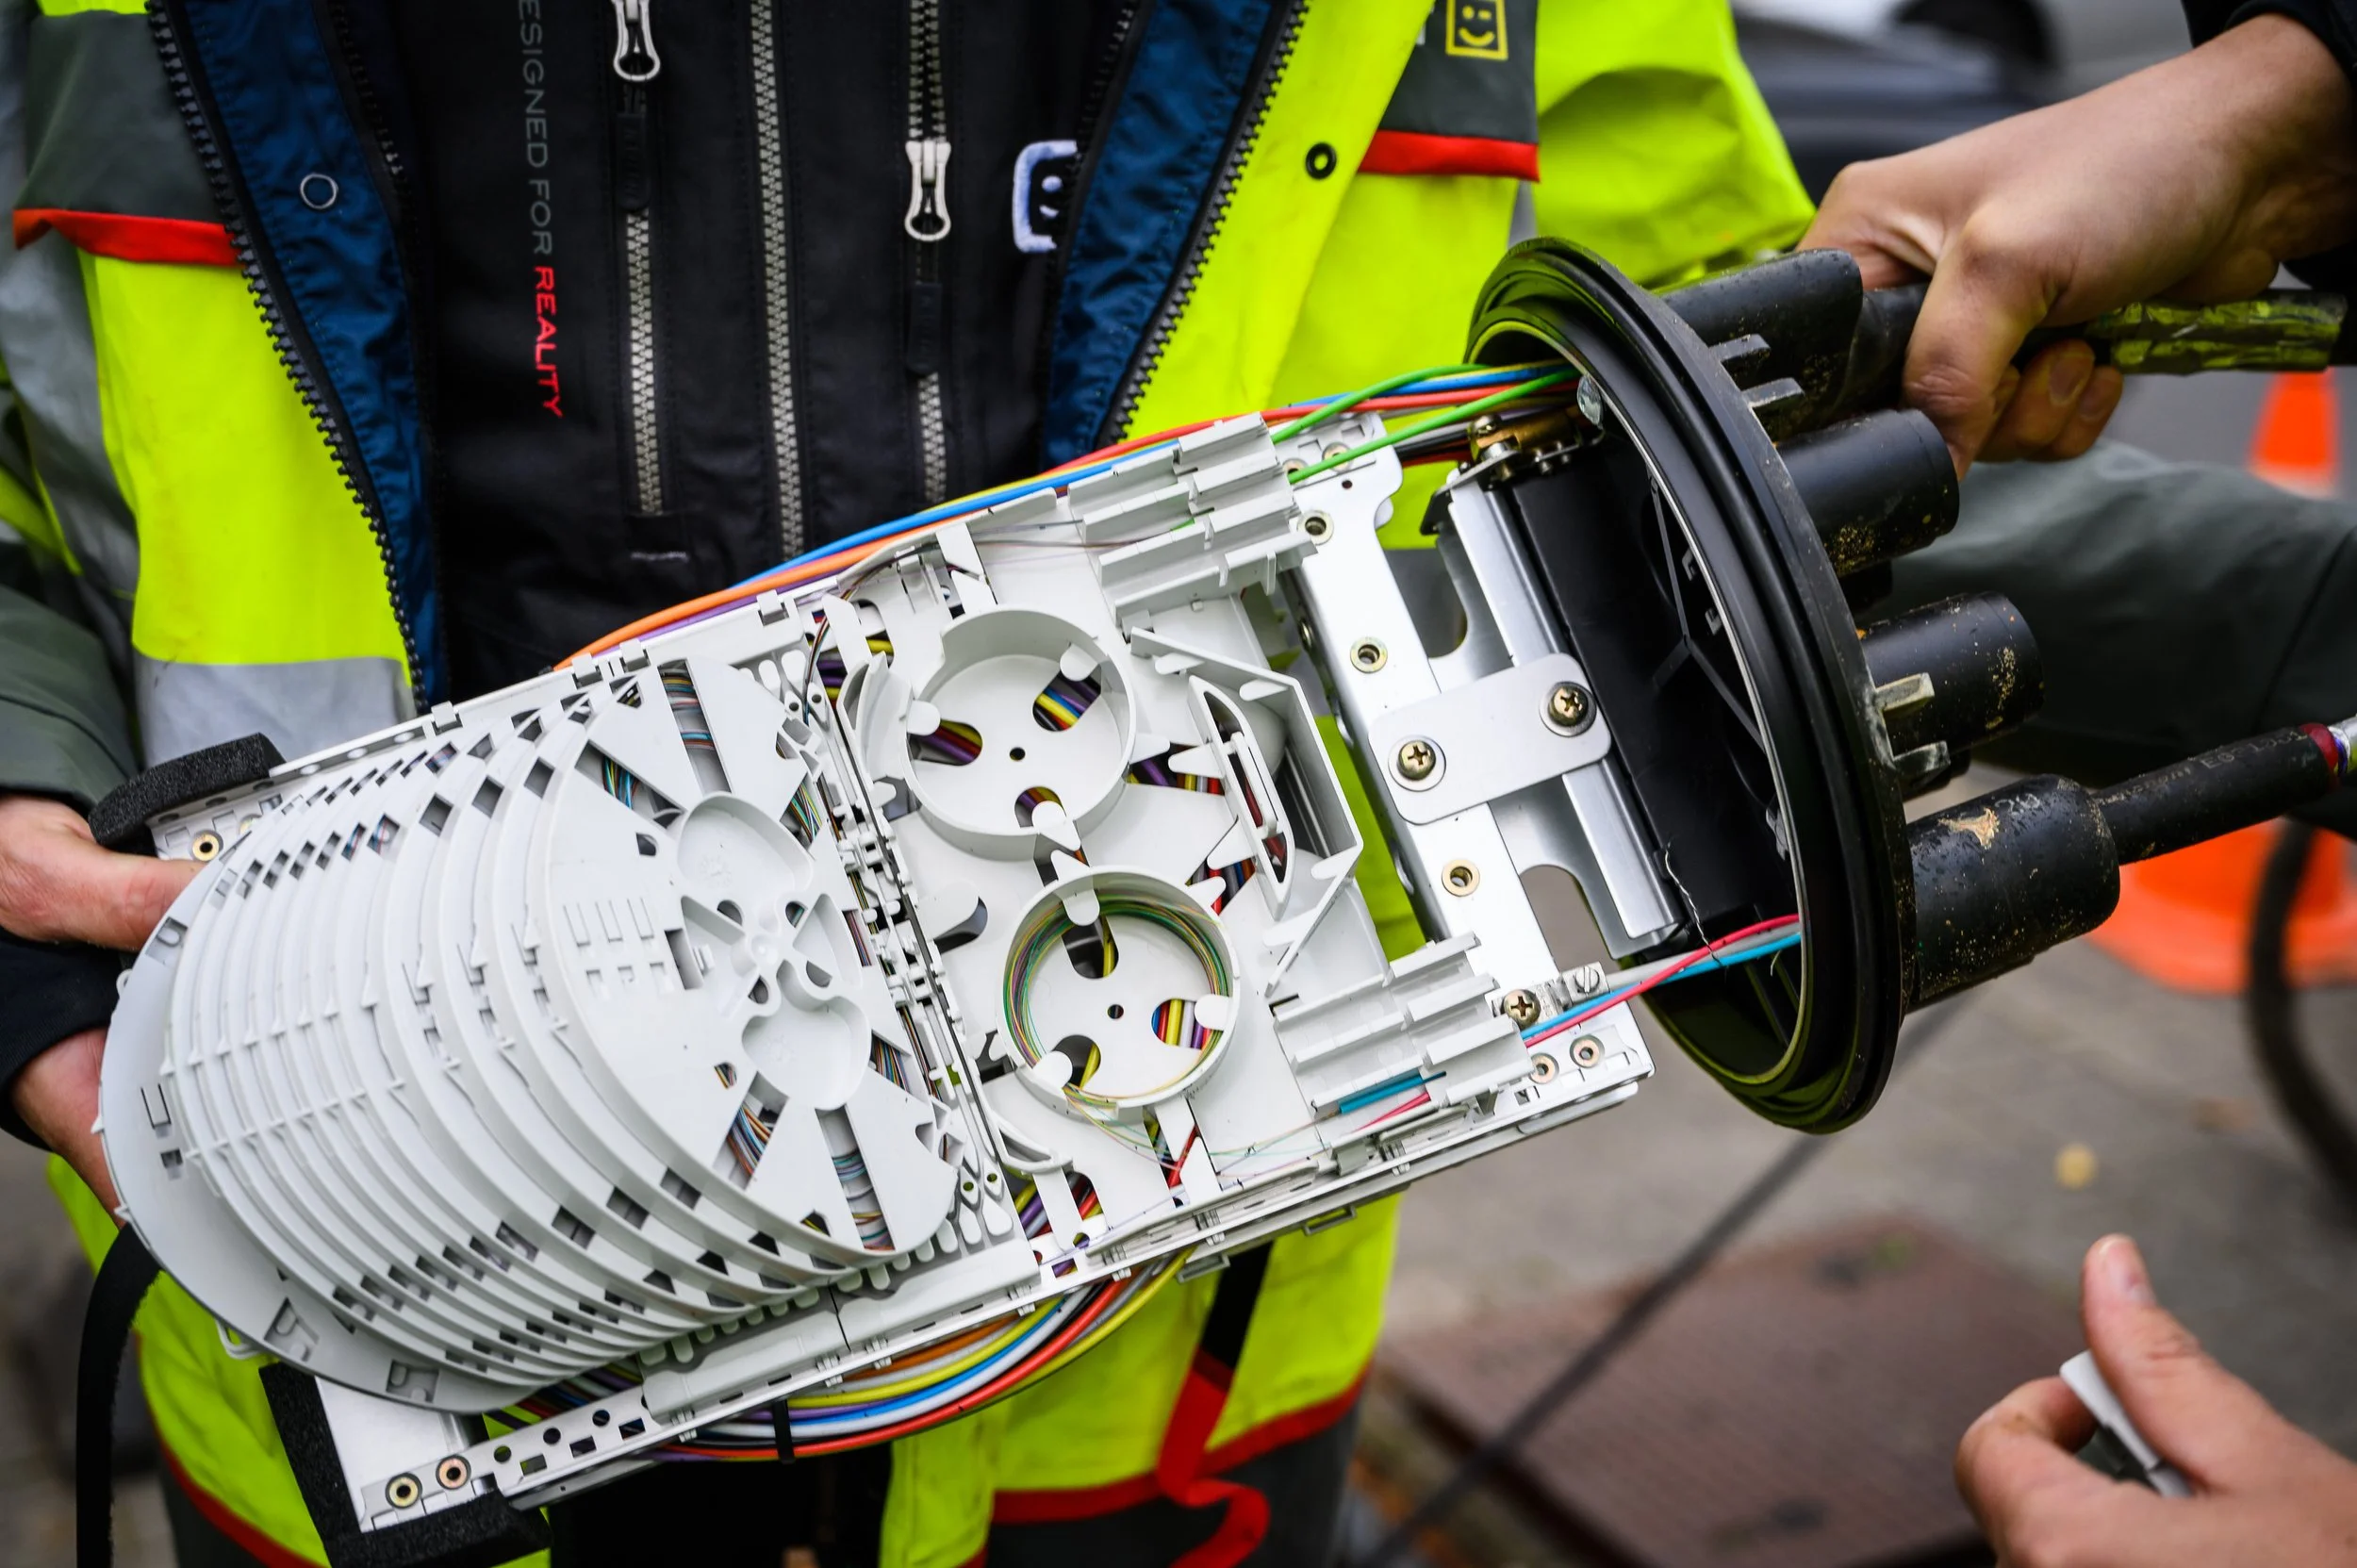
Neither of those is an argument against the current rules. They are an argument for asking a second question after the bid question, which is what the network is worth in year twenty.
What this means for planning a build
The practical takeaway is that this was never a technology decision at the regional level. It is a route-by-route decision, and it always was.
The right question is not whether your county is a fiber county. It is which segments of your footprint have the density and the existing pole infrastructure to make fiber the cheapest option, and which genuinely do not. Those two sets are usually easy to tell apart once someone walks the route, and much harder to guess at from a map.
Technology neutrality did not defeat fiber. It made fiber prove its case at 3.79 million locations, and fiber won most of them by building where the poles already are.
Evaluating fiber economics on a specific route? TermLink Solutions provides turn-key aerial fiber construction, splicing, and testing for ISPs, municipalities, and broadband authorities nationwide, with crews based in Central Pennsylvania. If you want an honest read on which segments of your footprint aerial fiber can serve cost-effectively, talk to our team.
